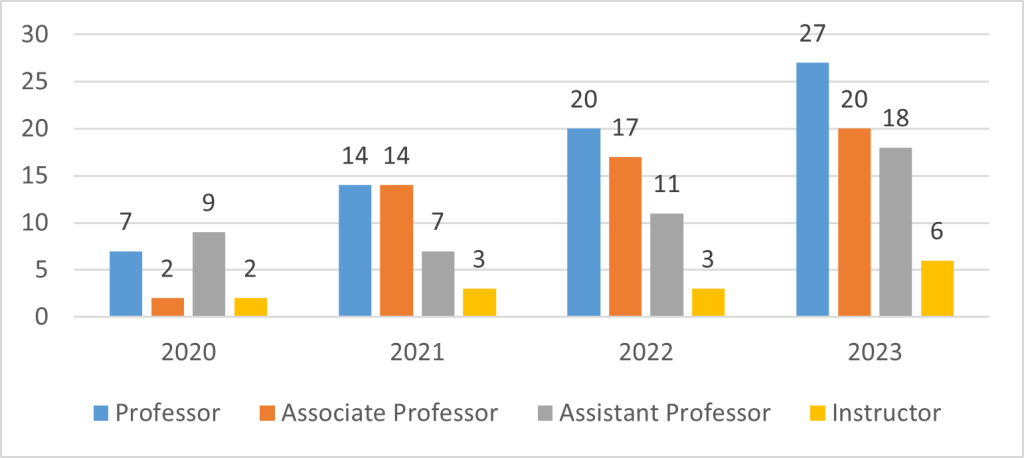
Faculty Member Statistics by Academic Ranking
| Year | Professor | Associate Professor | Assistant Professor | Instructor | |
| 1 | 2020 | 7 | 2 | 9 | 2 |
| 2 | 2021 | 14 | 14 | 7 | 3 |
| 3 | 2022 | 20 | 17 | 11 | 3 |
| 4 | 2023 | 27 | 20 | 18 | 6 |
Distribution of Faculty Members (males/females)
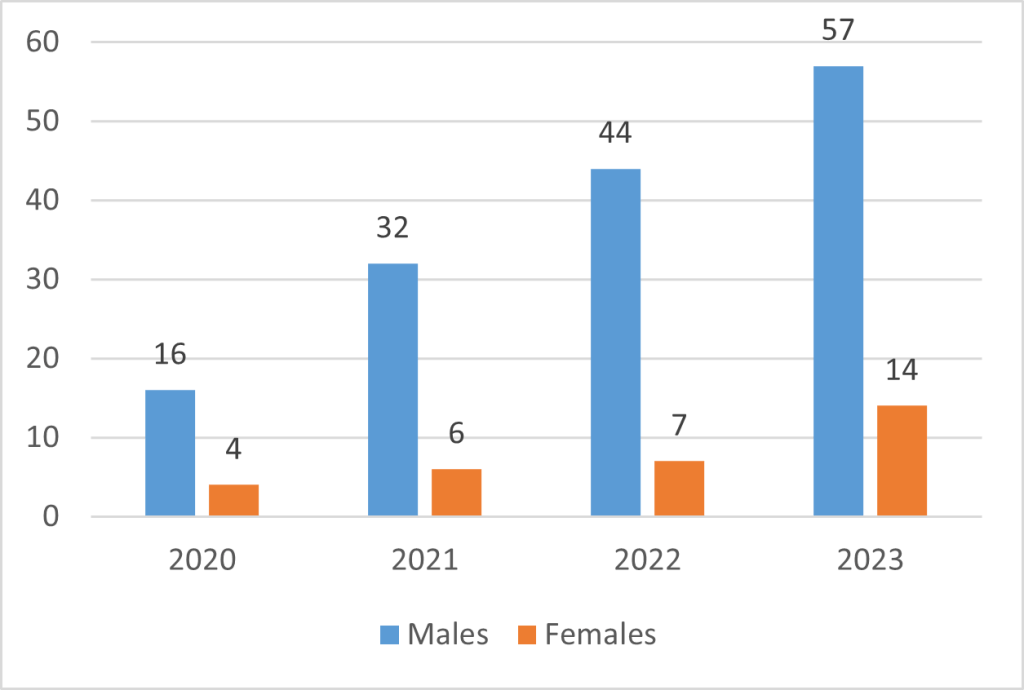
| Year | Males | Females | |
| 1 | 2020 | 16 | 4 |
| 2 | 2021 | 32 | 6 |
| 3 | 2022 | 44 | 7 |
| 4 | 2023 | 57 | 14 |
Distribution of Faculty Members by Nationality
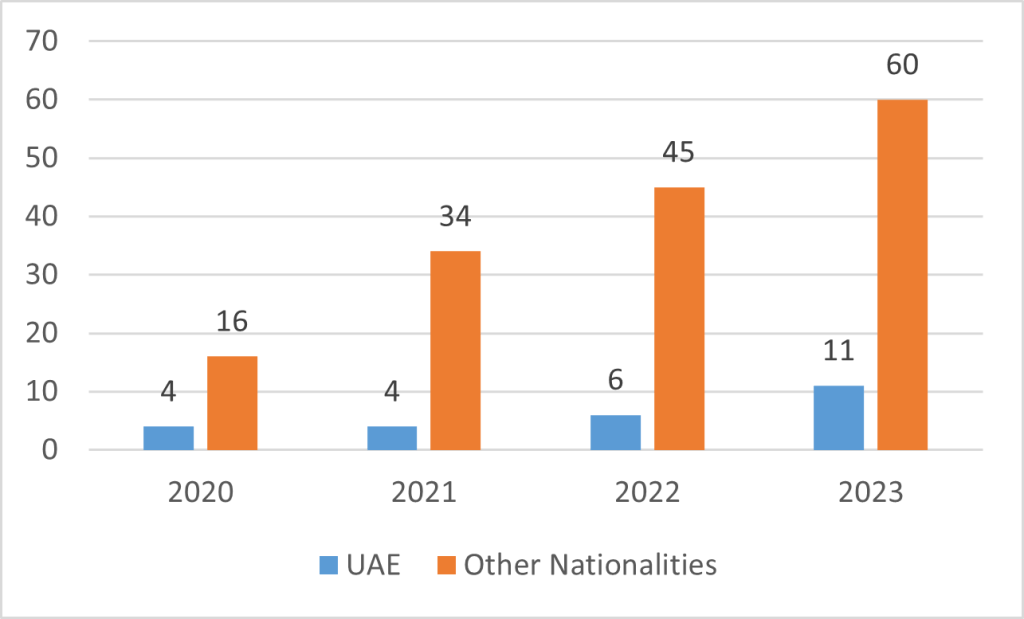
| Year | UAE | Other Nationalities | |
| 1 | 2020 | 4 | 16 |
| 2 | 2021 | 4 | 34 |
| 3 | 2022 | 6 | 45 |
| 4 | 2023 | 11 | 60 |
Distribution of Administrative Staff (UAE /Other Nationalities)
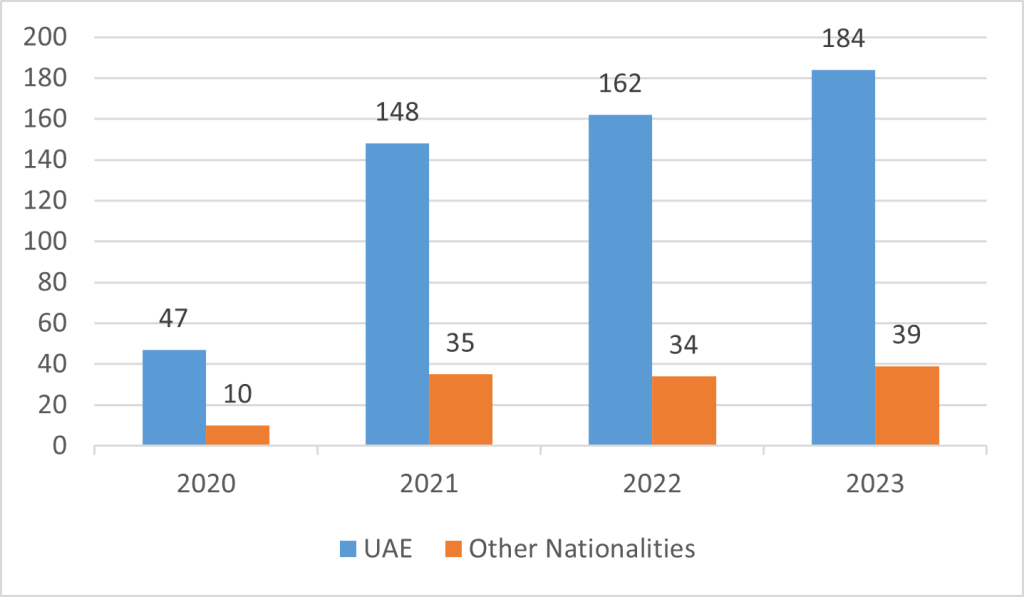
| Year | UAE | Other Nationalities | |
| 1 | 2020 | 47 | 10 |
| 2 | 2021 | 148 | 35 |
| 3 | 2022 | 162 | 34 |
| 4 | 2023 | 184 | 39 |
Distribution of Employees (males/females)
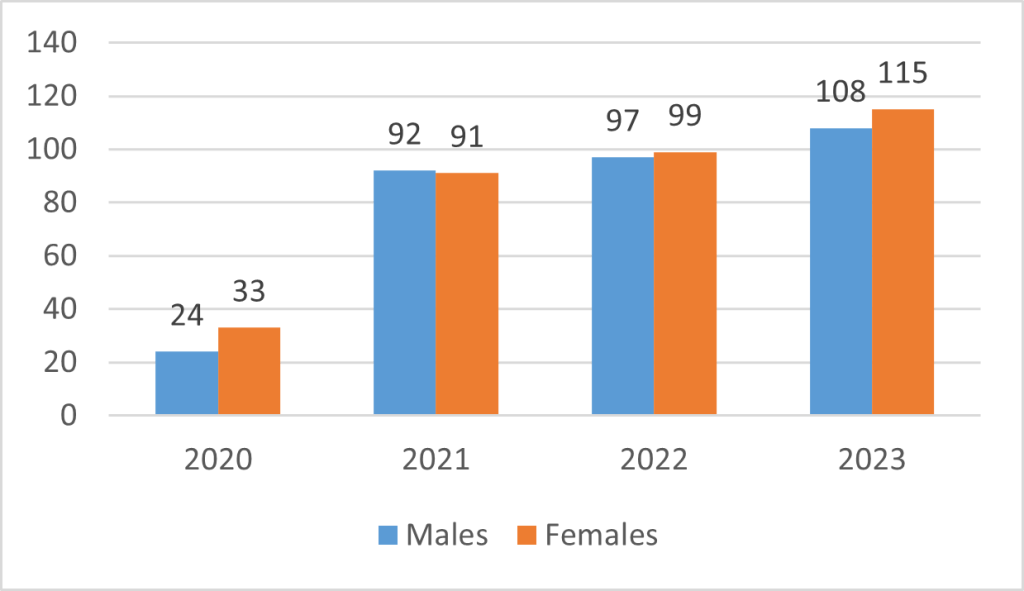
| Year | Males | Females | |
| 1 | 2020 | 24 | 33 |
| 2 | 2021 | 92 | 91 |
| 3 | 2022 | 97 | 99 |
| 4 | 2023 | 108 | 115 |
Enrolled Students by Degree (program)
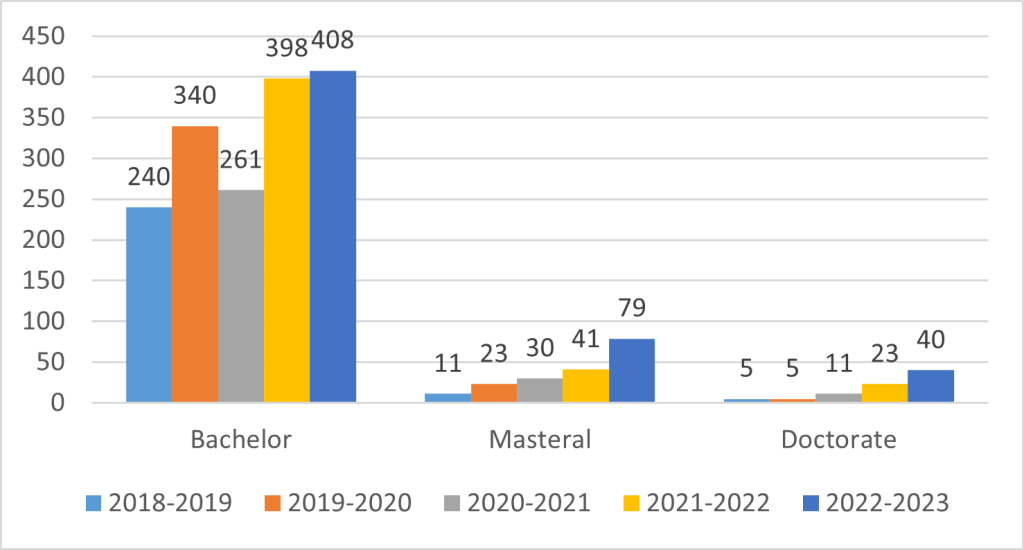
| Year | Bachelor | Masteral | Doctorate |
| 2018-2019 | 240 | 11 | 5 |
| 2019-2020 | 340 | 23 | 5 |
| 2020-2021 | 261 | 30 | 11 |
| 2021-2022 | 398 | 41 | 23 |
| 2022-2023 | 408 | 79 | 40 |
Distribution of Enrolled Students (males/females)
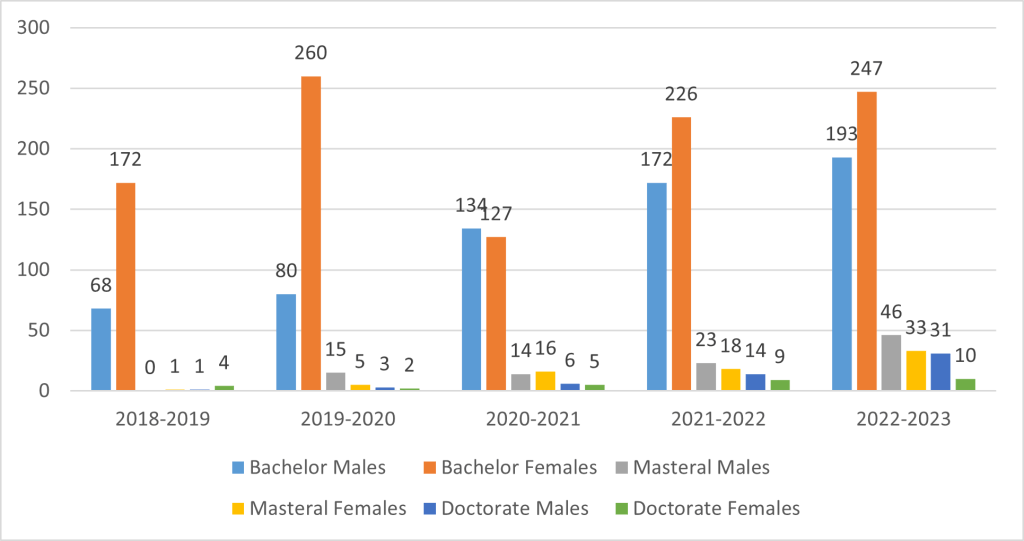
| Academic year | Bachelor | Masteral | Doctorate | |||
| Males | Females | Males | Females | Males | Females | |
| 2018-2019 | 68 | 172 | 0 | 1 | 1 | 4 |
| 2019-2020 | 80 | 260 | 15 | 5 | 3 | 2 |
| 2020-2021 | 134 | 127 | 14 | 16 | 6 | 5 |
| 2021-2022 | 172 | 226 | 23 | 18 | 14 | 9 |
| 2022-2023 | 193 | 247 | 46 | 33 | 31 | 10 |
Enrolled Students by Nationality
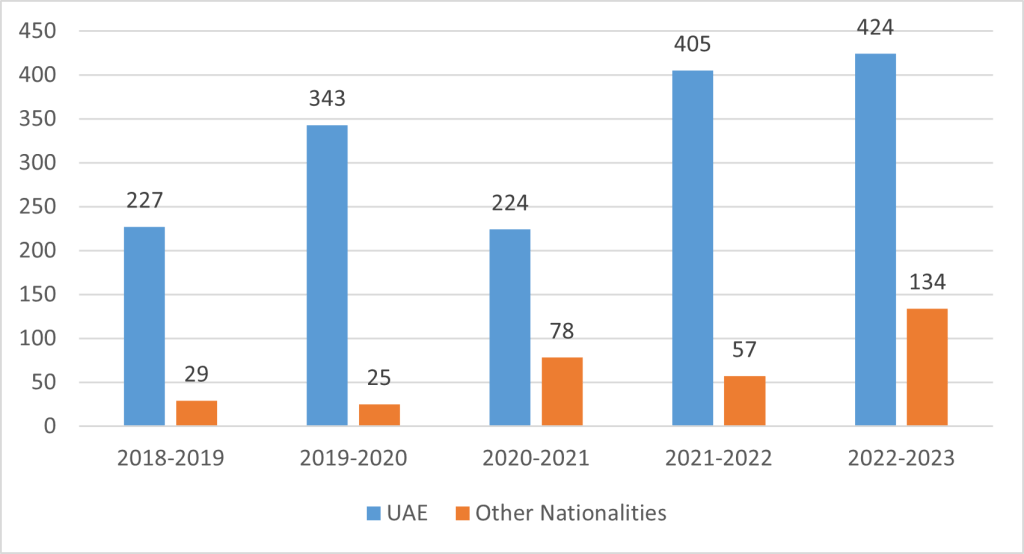
| Academic year | UAE | Other Nationalities |
| 2018-2019 | 227 | 29 |
| 2019-2020 | 343 | 25 |
| 2020-2021 | 224 | 78 |
| 2021-2022 | 405 | 57 |
| 2022-2023 | 424 | 134 |
Enrolled Students by Nationality for Each Program
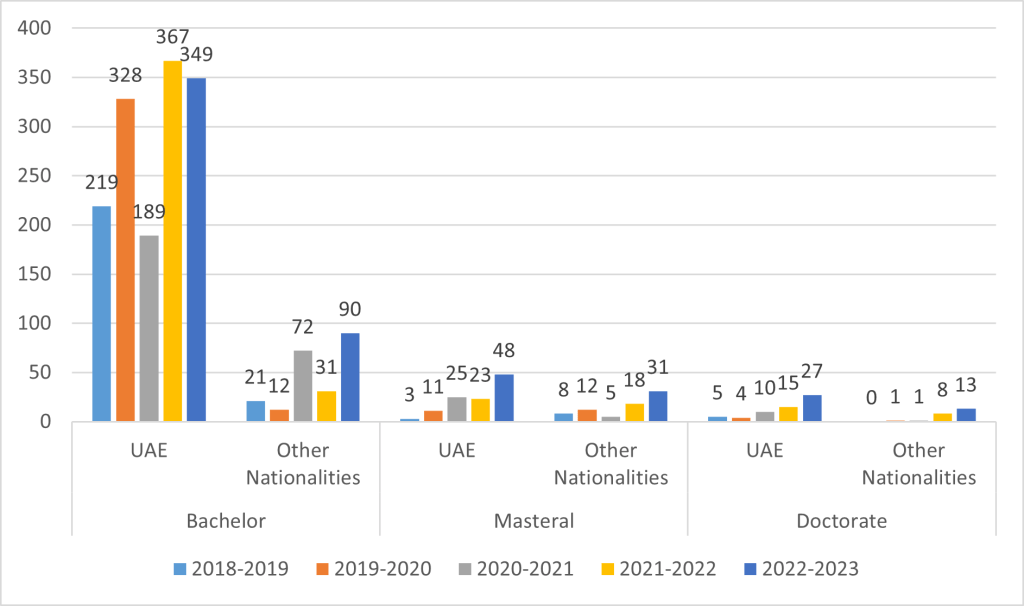
| Academic year | Bachelor | Masteral | Doctorate | |||
| UAE | Other Nationalities | UAE | Other Nationalities | UAE | Other Nationalities | |
| 2018-2019 | 219 | 21 | 3 | 8 | 5 | 0 |
| 2019-2020 | 328 | 12 | 11 | 12 | 4 | 1 |
| 2020-2021 | 189 | 72 | 25 | 5 | 10 | 1 |
| 2021-2022 | 367 | 31 | 23 | 18 | 15 | 8 |
| 2022-2023 | 349 | 90 | 48 | 31 | 27 | 13 |
Alumni Distribution by Program
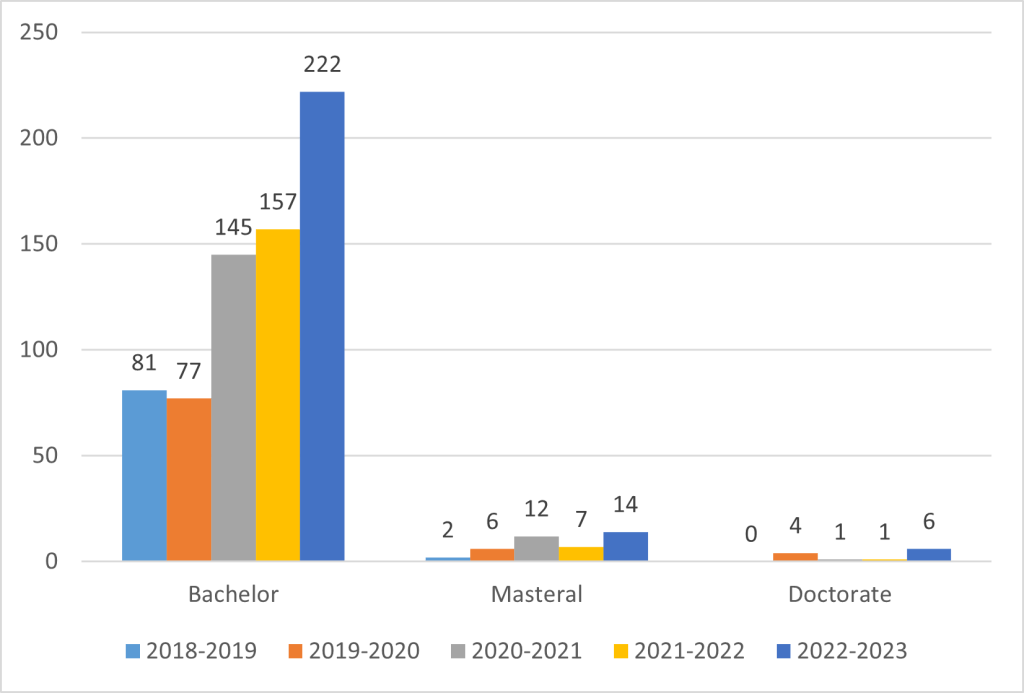
| Academic year | Bachelor | Masteral | Doctorate |
| 2018-2019 | 81 | 2 | 0 |
| 2019-2020 | 77 | 6 | 4 |
| 2020-2021 | 145 | 12 | 1 |
| 2021-2022 | 157 | 7 | 1 |
| 2022-2023 | 222 | 14 | 6 |
Alumni Distribution (males/females) by Program
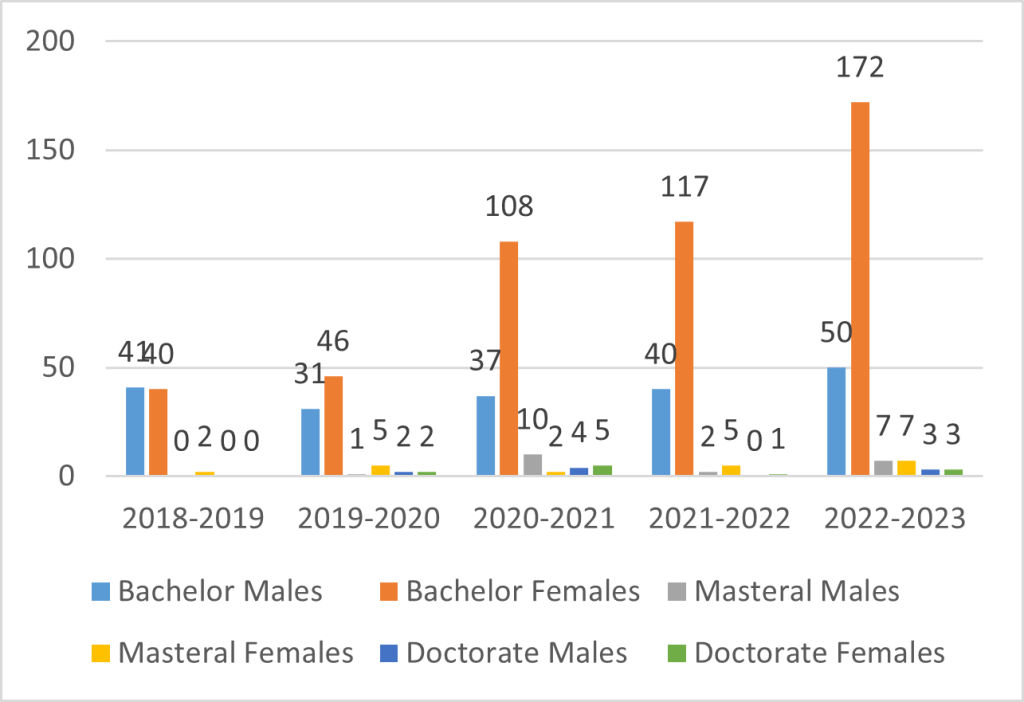
| Academic year | Bachelor | Masteral | Doctorate | |||
| Males | Females | Males | Females | Males | Females | |
| 2018-2019 | 41 | 40 | 0 | 2 | 0 | 0 |
| 2019-2020 | 31 | 46 | 1 | 5 | 2 | 2 |
| 2020-2021 | 37 | 108 | 10 | 2 | 4 | 5 |
| 2021-2022 | 40 | 117 | 2 | 5 | 0 | 1 |
| 2022-2023 | 50 | 172 | 7 | 7 | 3 | 3 |
Distribution of Alumni by Nationality
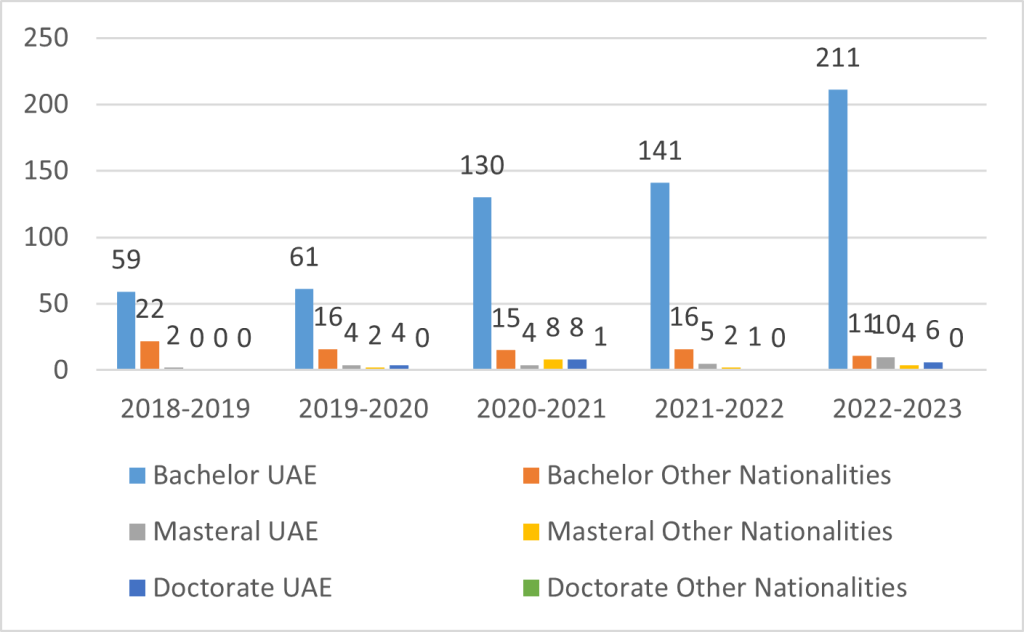
| Academic year | Bachelor | Masteral | Doctorate | |||
| UAE | Other Nationalities | UAE | Other Nationalities | UAE | Other Nationalities | |
| 2018-2019 | 59 | 22 | 2 | 0 | 0 | 0 |
| 2019-2020 | 61 | 16 | 4 | 2 | 4 | 0 |
| 2020-2021 | 130 | 15 | 4 | 8 | 8 | 1 |
| 2021-2022 | 141 | 16 | 5 | 2 | 1 | 0 |
| 2022-2023 | 211 | 11 | 10 | 4 | 6 | 0 |
Cumulative Average Statistics for the Bachelor Program
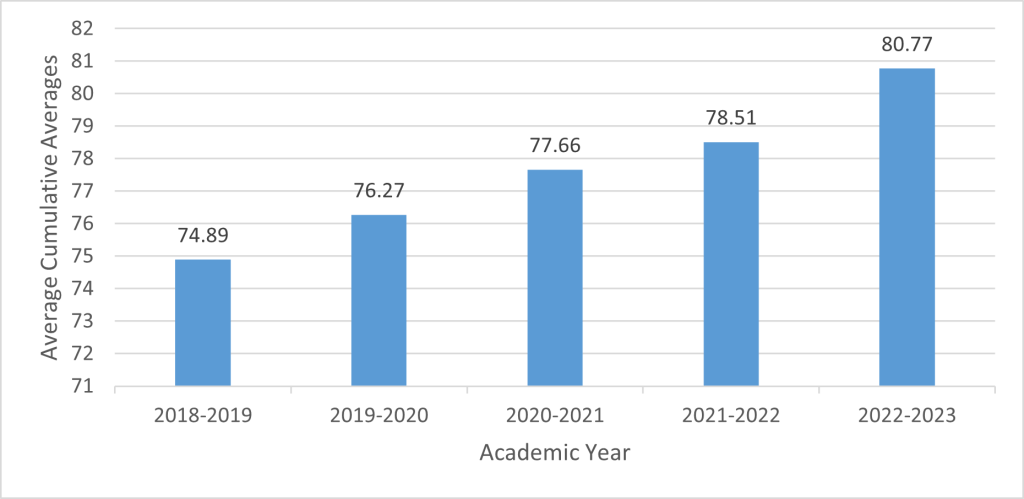
| Academic Year | Average Cumulative Averages | |
| 1 | 2018-2019 | 74.89 |
| 2 | 2019-2020 | 76.27 |
| 3 | 2020-2021 | 77.66 |
| 4 | 2021-2022 | 78.51 |
| 5 | 2022-2023 | 80.77 |
Attendance and Absence Statistics for the Bachelor Program
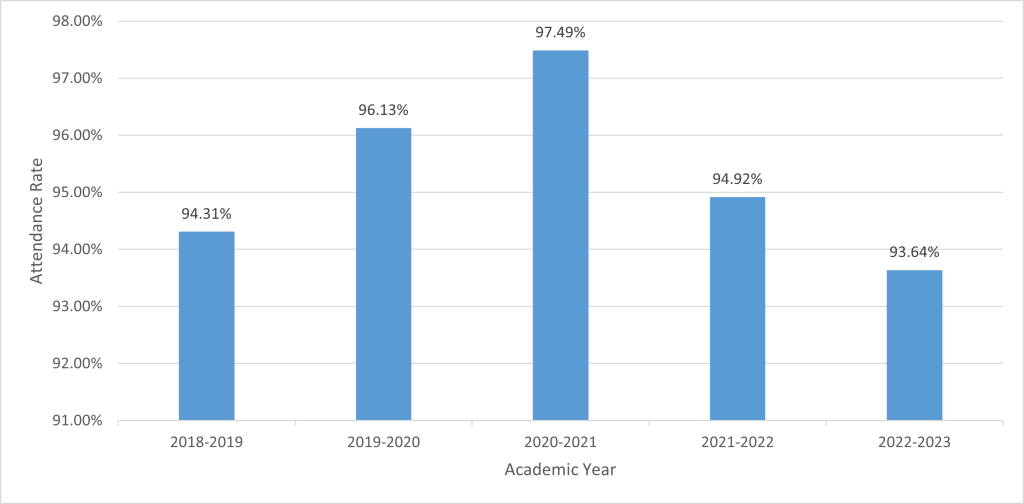
| Academic Year | Attendance Rate | |
| 1 | 2018-2019 | 94.31% |
| 2 | 2019-2020 | 96.13% |
| 3 | 2020-2021 | 97.49% |
| 4 | 2021-2022 | 94.92% |
| 5 | 2022-2023 | 93.64% |
Student Retention Statistics for the Bachelor Program
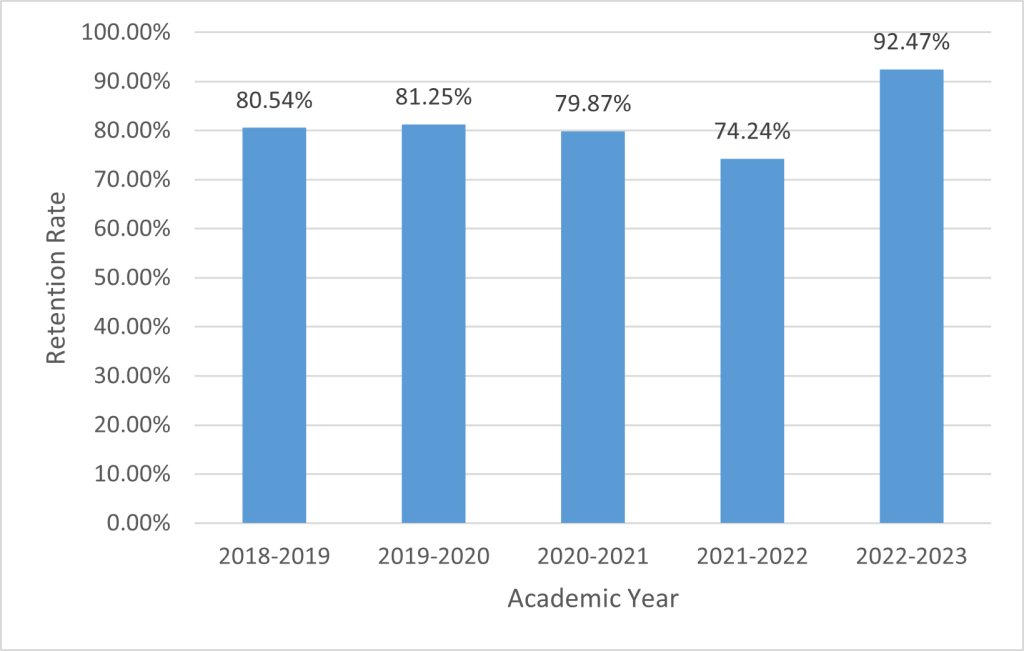
| Academic Year | Retention Rate | |
| 1 | 2018-2019 | 80.54% |
| 2 | 2019-2020 | 81.25% |
| 3 | 2020-2021 | 79.87% |
| 4 | 2021-2022 | 74.24% |
| 5 | 2022-2023 | 92.47% |
Annual Completion Rate Statistics for the Bachelor Program
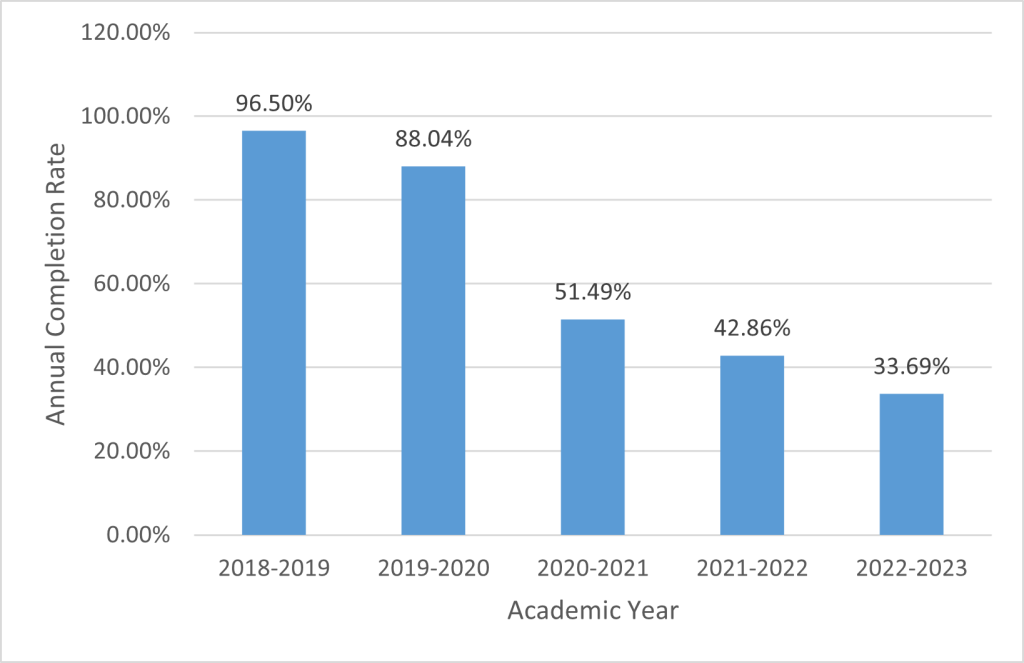
| Academic Year | Annual Completion Rate | |
| 1 | 2018-2019 | 96.50% |
| 2 | 2019-2020 | 88.04% |
| 3 | 2020-2021 | 51.49% |
| 4 | 2021-2022 | 42.86% |
| 5 | 2022-2023 | 33.69% |


