| SN. | Index | 2014/2015 | 2015/2016 | 2016/2017 | 2017/2018 | 2018/2019 |
| 1 | Overall Student to faculty ratio | 1:10 | 1:11 | 1:11 | 1:12.7 | 1:14.7 |
| 2 | Percentage of students who quit university | 3.6% | 0.7% | 0.3% | 3.2% | 1.73% |
| 3 | Percentage of students dismissed from university | 5.8% | 7% | 3.9% | 2% | 1.39 |
| 4 | Number of students enrolled, compared to the strategic plan of the university | 70% | 99.3% | 100% | 97% | 110% |
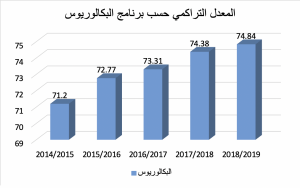
| 5 | The GPA for undergraduate students | 71.2% | 72.77% | 73.31% | %74.38 | 74.48% |
| 6 | Student satisfaction with faculty | 81.23% | 87.27% | 82.15% | 84.46% | 86.4% |
| 7 | Student satisfaction with university services | 73.53% | 70.51% | 62.56% | 59.2% | 78.92% |
| 8 | Student satisfaction with courses | 81.38% | 81.38% | 82.71% | 83.53 | 84.17% |
| 9 | Local students percentage | 70.29% | 73% | 77.13% | 83% | 86% |
| 10 | Graduate students’ evaluation Of academic program quality | 79.26 | 88.5% | 81.2% | 75.53% | 79.29% |
| 11 | Percentage of working students after graduation | 98% | 97% | 96% | 96% | 94.4% |
| 12 | Evaluation by employers of graduate students of the quality of academic programs | 85.16 | 92.78% | 80% | 87.33% | 82.81% |
| 13 | Number of community service hours by faculty members | 90 hours | 80 hours | 105 hours | 105 | 218 |
| 14 | Number of hours of community service by students | 24 hours | 27 hours | 30 hours | 90 | 92 |
| 15 | Percentage of faculty members absent from lectures | 1% | 0.1% | 0% | 0% | 0% |
| 16 | Lecture attendance by students | 97% | 95.44% | 96.22% | 97.1% | 97.22% |
| 17 | The percentage of students who enrolled in courses out of the number of students who were admitted to the university in the first semester of the first academic year | 63% | 87% | 92.12% | 57.8% | 57.5% |
| 18 | Ratio of specialized books per student | 1:12 | 1:15 | 1:16 | 1:21 | 1:20.4 |
| 19 | Average student number per semester B.A | 14 | 24 | 23 | 25 | 29 |
| 20 | Faculty members’ satisfaction with university services | 92.47% | 91.79% | 88.64% | 90.91% | 92.25% |
| 21 | Average high school average for students enrolled in the first year at the university | 86.5% | 85.7% | 86.65% | 83.82% | 85% |
| 22 | The percentage of graduate students’ satisfaction with supervision | 83.97% | 85.45% | %95.57 | 92.8% | 92.8% |
| 23 | Emiratizations percentage in the administration | 31.5% | 37% | 41% | 60.5% | 61.2% |
| 24 | Job turnover rate | 1% | 2 % | 2 % | 2.1% | 2.2% |
| 25 | Percentage of employees’ commitment to time (attendance and departure) | —- | 94% | 96% | 97% | 97.24 |
| 26 | The percentage of savings in the university’s expenses as a result of increasing its efficiency | —- | 5% | 6% | 19.9% | 16% |
| 27 | The auditor issued an unqualified report on the financial statements | —- | 100% | 100% | 100% | 100% |
The following tables show the statistics of the faculty members.
| Period | Faculty | Total | Assistant Professor | Total | Assistant Professor | Total | Faculty |
Total |
Total (Male) |
Total (Females) |
Total teachers per semester | |||||
| Males | Females | Males | Females | Males | Females | Males | Females | |||||||||
| Fall 2014/2015 | 14 | 1 | 15 | 0 | 3 | 3 | 2 | 0 | 2 | 0 | 1 | 1 | 16 | 5 | 21 | |
| Spring 2014/2015 | 13 | 1 | 14 | 1 | 2 | 3 | 3 | 1 | 4 | 1 | 4 | 5 | 18 | 8 | 26 | |
| Fall 2015/2016 | 11 | 0 | 11 | 3 | 3 | 6 | 5 | 2 | 7 | 0 | 0 | 0 | 19 | 5 | 24 | |
| Spring 2015/2016 |
11 | 0 | 11 | 2 | 2 | 4 | 7 | 3 | 10 | 0 | 0 | 0 | 20 | 5 | 25 | |
| Fall 2016/2017 |
10 | 0 | 10 | 0 | 2 | 2 | 11 | 5 | 16 | 0 | 0 | 0 | 21 | 7 | 28 | |
| Spring 2016/2017 |
12 | 1 | 13 | 4 | 2 | 6 | 9 | 5 | 14 | 0 | 2 | 2 | 25 | 10 | 35 | |
| Fall 2017/2018 | 11 | 1 | 12 | 8 | 2 | 10 | 10 | 4 | 14 | 1 | 3 | 4 | 30 | 10 | 40 | |
| Spring 2017/2018 |
17 | 2 | 19 | 6 | 2 | 8 | 12 | 4 | 16 | 1 | 0 | 1 | 36 | 8 | 44 | |
| Fall 2018/2019 | 13 | 2 | 15 | 6 | 1 | 7 | 14 | 3 | 17 | 1 | 3 | 4 | 34 | 9 | 43 | |
| Spring 2018/2019 | 15 | 2 | 17 | 8 | 1 | 9 | 18 | 5 | 23 | 1 | 0 | 1 | 41 | 9 | 50 | |
The following tables show statistics of the university’s administrative staff.
| Academic year section | 2014/2015 | 2015/2016 | 2016/2017 | 2017/2018 | 2018/2019 |
| Chancellor | 1 | 1 | 1 | 1 | 1 |
| Vice-chancellor for financial and management affairs | 0 | 0 | 1 | 1 | 1 |
| Vice-chancellor for academic affairs | 1 | 1 | 1 | 2 | 1 |
| Vice-chancellor for student affairs | 0 | 0 | 0 | 0 | 1 |
| Human resources | 1 | 1 | 1 | 3 | 4 |
| Finance | 2 | 2 | 2 | 3 | 4 |
| Purchases | 1 | 1 | 1 | 3 | 3 |
| Public relations | 1 | 1 | 1 | 3 | 2 |
| IT | 2 | 2 | 2 | 3 | 5 |
| Services | 2 | 2 | 2 | 4 | 4 |
| Quality | 2 | 2 | 2 | 2 | 2 |
| Registration | 1 | 1 | 2 | 4 | 4 |
| Student affairs | 2 | 2 | 2 | 2 | 3 |
| Library | 2 | 2 | 2 | 5 | 5 |
| Manager assistant | 2 | 4 | 5 | 4 | 3 |
| Reception | 2 | 2 | 2 | 1 | 2 |
| Student recruitment and career guidance | 0 | 0 | 0 | 3 | 2 |
| Continuing education and community service | 0 | 0 | 0 | 2 | 2 |
| Department of Education Technology and Learning Resources | 0 | 0 | 0 | 2 | 2 |
| Total | 22 | 24 | 27 | 48 | 51 |
statistics about the number of students enrolled in the university.
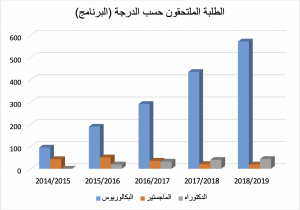
- Students enrolled by degree (program)
| BA | MA | Doctorate | Total |
| 572 | 19 | 44 | 635 |
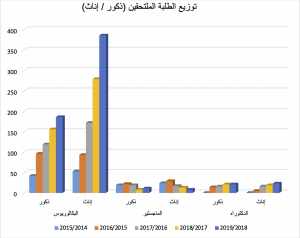
- Enrolled students (males/females)
| Academic year | BA | MA | Doctorate | Total | |||
| males | females | males | females | males | females | ||
| 2014/2015 | 42 | 53 | 19 | 24 | 0 | 0 | 138 |
| 2015/2016 | 96 | 93 | 22 | 29 | 14 | 5 | 259 |
| 2016/2017 | 119 | 172 | 19 | 17 | 16 | 16 | 359 |
| 2018/2017 | 156 | 279 | 8 | 13 | 21 | 19 | 496 |
| 2018/2019 | 186 | 386 | 11 | 8 | 21 | 23 | 635 |
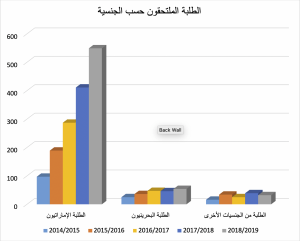
Enrolled students per nationality
| Academic year | Emirati students | Bahraini students | Other nationalities | Total |
| 2014/2015 | 97 | 25 | 16 | 138 |
| 2015/2016 | 189 | 36 | 34 | 259 |
| 2016/2017 | 287 | 47 | 25 | 359 |
| 2018/2017 | 411 | 46 | 39 | 496 |
| 2018/2019 | 549 | 54 | 32 | 635 |
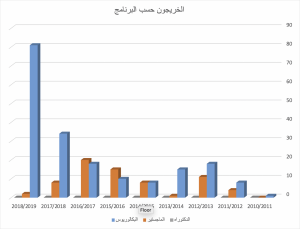
- Graduates by Degree (Program)
| Academic year | BA | MA | Doctorate | Total |
| 2010/2011 | 1 | 0 | 0 | 1 |
| 2011/2012 | 8 | 4 | 0 | 12 |
| 2012/2013 | 18 | 11 | 0 | 29 |
| 2013/2014 | 15 | 1 | 0 | 16 |
| 2014/2015 | 8 | 8 | 0 | 16 |
| 2015/2016 | 10 | 15 | 0 | 25 |
| 2016/2017 | 18 | 20 | 0 | 38 |
| 2018/2017 | 34 | 8 | 0 | 42 |
| 2018/2019 | 81 | 2 | 0 | 83 |
- Graduates by nationality
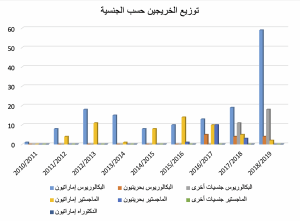
| Academic year | BA | MA | Doctorate | Total | ||||
| Emirati | Bahraini | other | Emirati | Bahraini | Other | Emirati | ||
| 2010/2011 | 1 | 0 | 0 | 0 | 0 | 0 | 0 | 1 |
| 2011/2012 | 8 | 0 | 0 | 4 | 0 | 0 | 0 | 12 |
| 2012/2013 | 18 | 0 | 0 | 11 | 0 | 0 | 0 | 29 |
| 2013/2014 | 15 | 0 | 0 | 1 | 0 | 0 | 0 | 16 |
| 2014/2015 | 8 | 0 | 0 | 8 | 0 | 0 | 0 | 16 |
| 2015/2016 | 10 | 0 | 0 | 14 | 1 | 0 | 0 | 25 |
| 2016/2017 | 13 | 5 | 0 | 10 | 10 | 0 | 0 | 38 |
| 2017/2018 | 19 | 4 | 11 | 5 | 3 | 0 | 0 | 42 |
| 2018/2019 | 59 | 4 | 18 | 2 | 0 | 0 | 0 | 83 |
| Academic year | GPA average |
| 2014/2015 | 71.2 |
| 2015/2016 | 72.77 |
| 2016/2017 | 73.31 |
| 2018/2017 | 74.38 |
| 2018/2019 | 74.84 |
