العربية
A
A
A
Apply now
Continuous Education Center
Contact us
Home
Welcome Statement – PRESIDENT OF HIGHER ACADEMIC COUNCIL
Welcome statement – Chairman of the Board of Trustees
Welcome statement – Chancellor
Higher Academic Council
Board of Trustees
Organizational Chart
About the university
About Mohamed Bin Zayed University for Humanities
Vision ,mission ,values ,priorities
Objectives
Accreditation
Achievements
Facts and Figures
Branch campuses
Why Mohamed Bin Zayed University for Humanities?
Admission
Admission Application
Admission Requirements
Required Registration Documents
Students’ Handbook
Academic Calendar
Apply Now
University Fees
Tuition Fees
Academic Advising Section
Academic Affairs
College of Islamic Studies
College of Social and Human Sciences
College of Arts & Languages
College of Graduate Studies and Scientific Research
Faculty
University life
University Life Services
Digital Student Services
Alumni Affairs Department
Graduation Certificate Request Service
Scientific Research
Book reviews journal
Publications
Mbzuh Publications
MBZUH Citation Guide
See More
Library
Database
Digital Warehouse
Library Catalog
Additional Library Sources
Library use guide
Research Centers
Media Center
News
Events
Conferences
MBZUH Brand Story
Cultural Seasons
House of wisdom series
Values of Islam
Open courses
Scientific Research Policy
Scientific Bulletin
Scientific Magazine
Graduate Theses
Discover more
Our Partners
Community Initiatives
Frequently Asked Questions
Facts and Figures
Home »
Facts and Figures
Faculty Member Statistics by Academic Ranking
Human Resources Statistics (Administrative Staff)
Student Enrollment Statistics
Alumni statistics
Academic Achievement Statistics
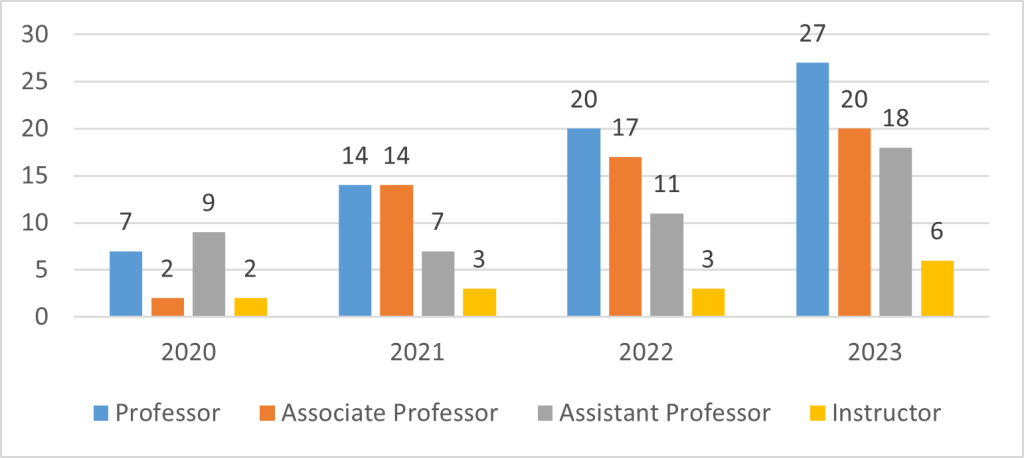
Faculty Member Statistics by Academic Ranking
Year
Professor
Associate Professor
Assistant Professor
Instructor
1
2020
7
2
9
2
2
2021
14
14
7
3
3
2022
20
17
11
3
4
2023
27
20
18
6
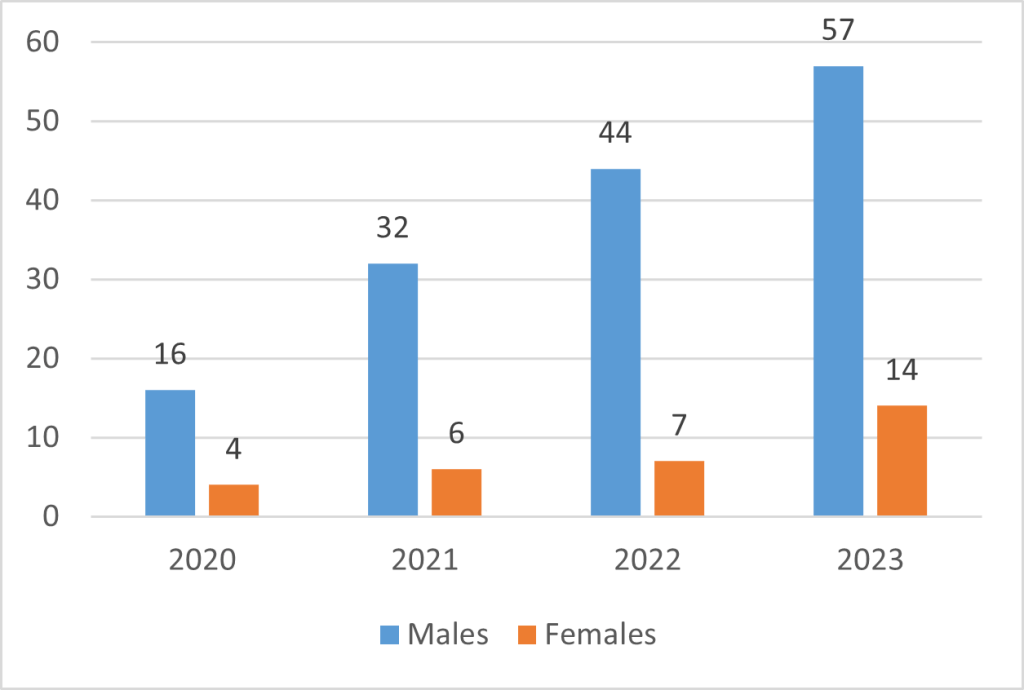
Distribution of Faculty Members (males/females)
Year
Males
Females
1
2020
16
4
2
2021
32
6
3
2022
44
7
4
2023
57
14
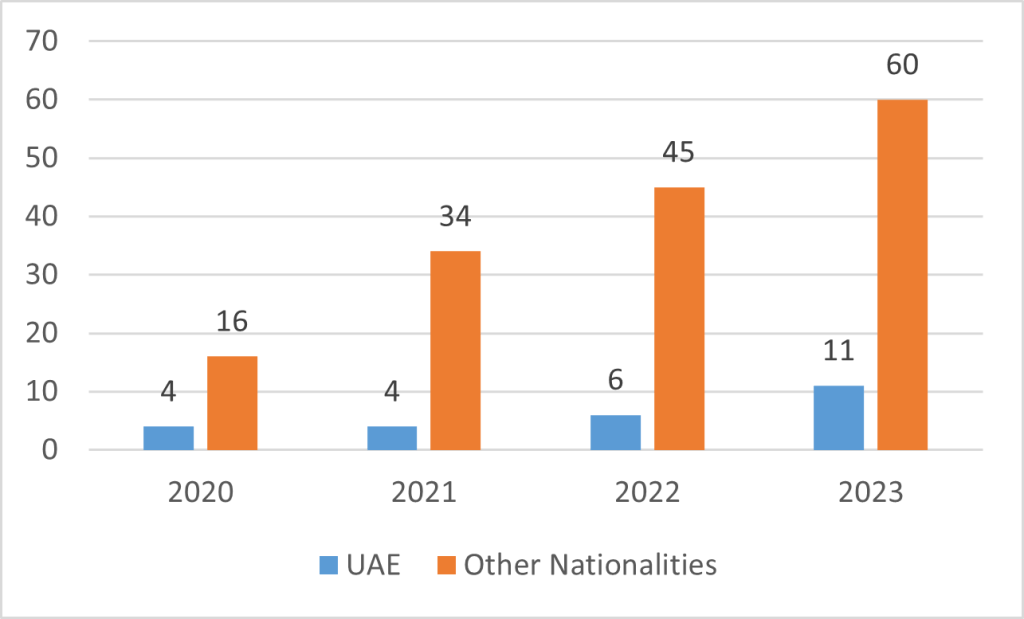
Distribution of Faculty Members by Nationality
Year
UAE
Other Nationalities
1
2020
4
16
2
2021
4
34
3
2022
6
45
4
2023
11
60
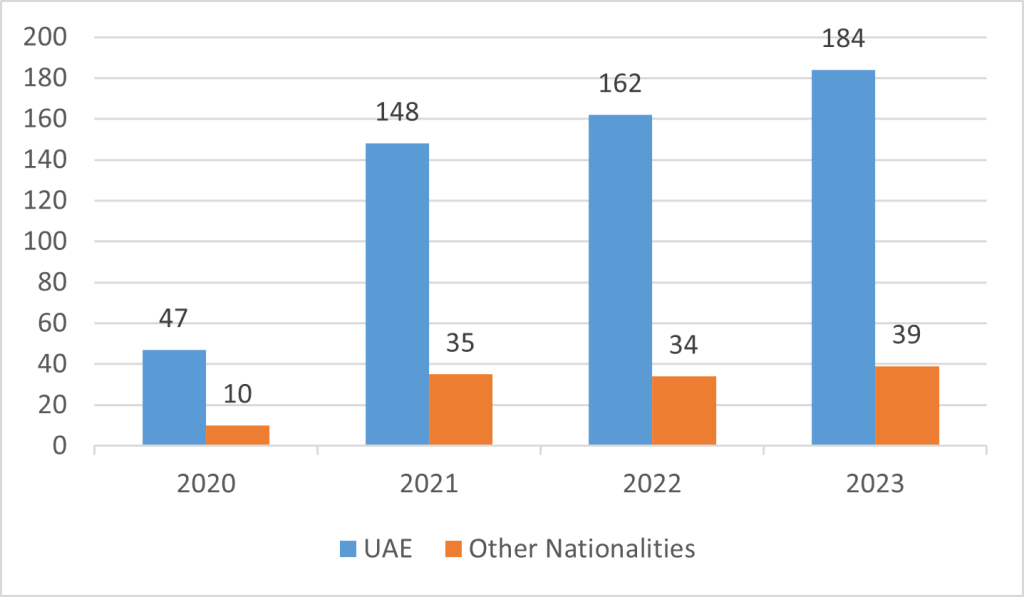
Distribution of Administrative Staff (UAE /Other Nationalities)
Year
UAE
Other Nationalities
1
2020
47
10
2
2021
148
35
3
2022
162
34
4
2023
184
39
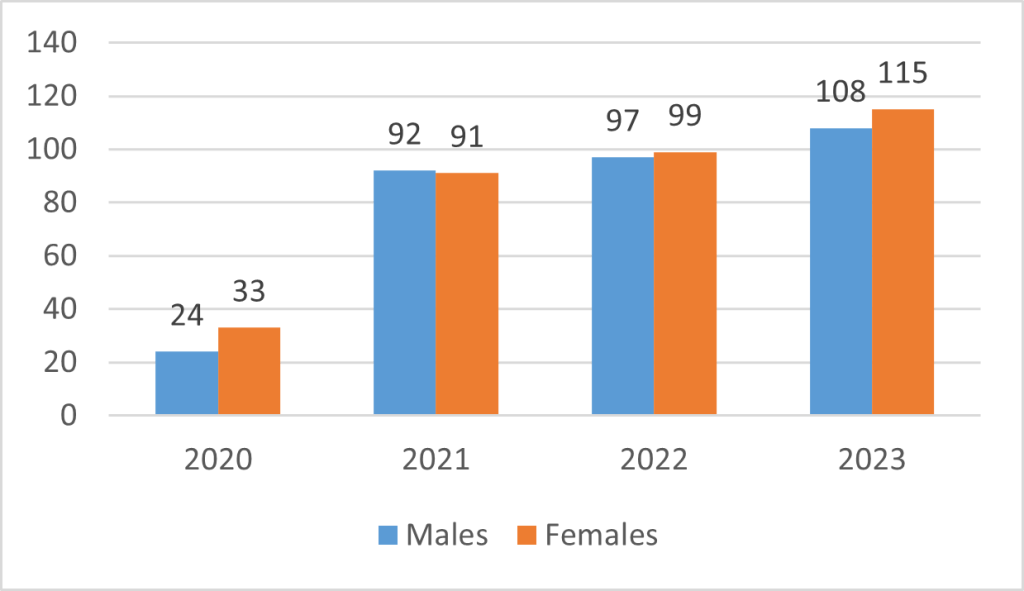
Distribution of Employees (males/females)
Year
Males
Females
1
2020
24
33
2
2021
92
91
3
2022
97
99
4
2023
108
115
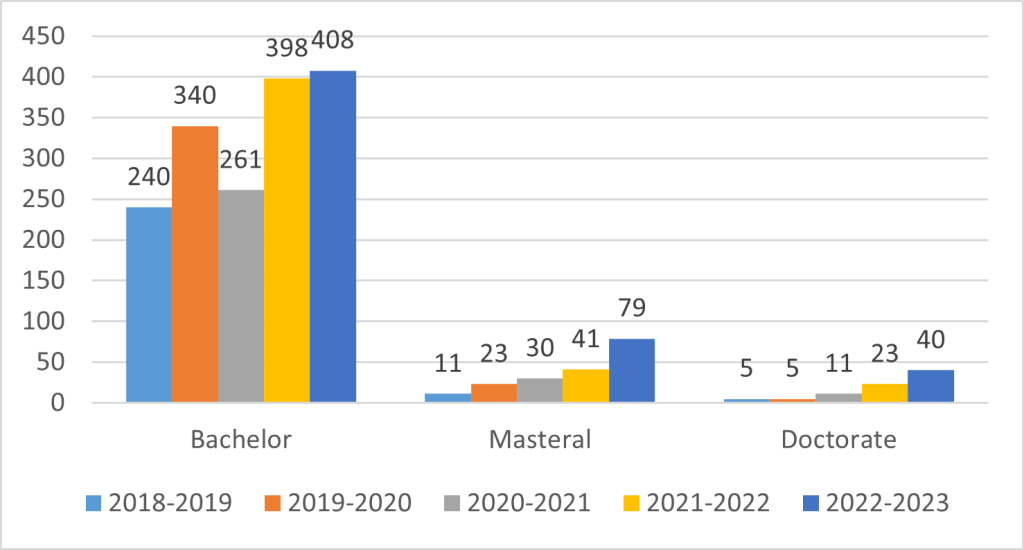
Enrolled Students by Degree (program)
Year
Bachelor
Masteral
Doctorate
2018-2019
240
11
5
2019-2020
340
23
5
2020-2021
261
30
11
2021-2022
398
41
23
2022-2023
408
79
40
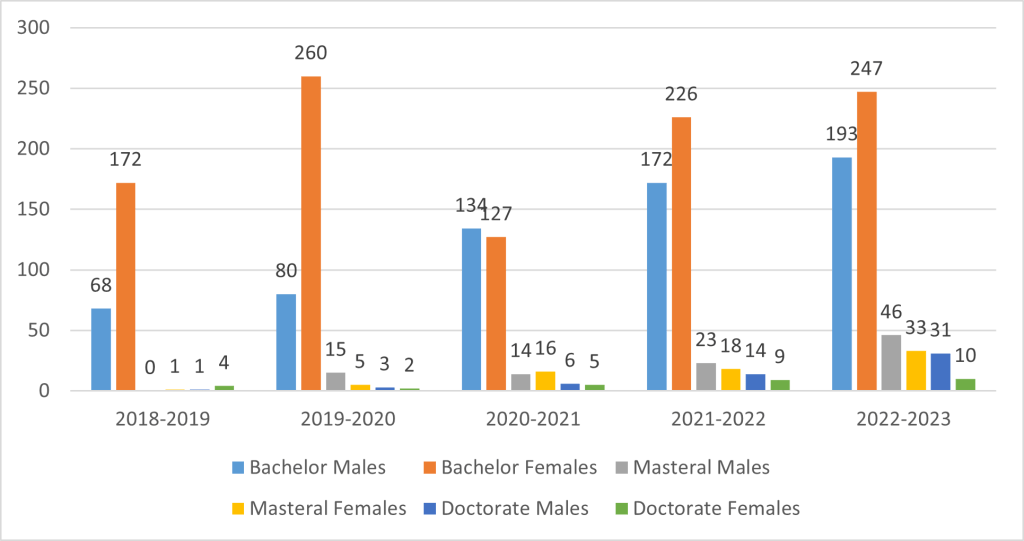
Distribution of Enrolled Students (males/females)
Academic year
Bachelor
Masteral
Doctorate
Males
Females
Males
Females
Males
Females
2018-2019
68
172
0
1
1
4
2019-2020
80
260
15
5
3
2
2020-2021
134
127
14
16
6
5
2021-2022
172
226
23
18
14
9
2022-2023
193
247
46
33
31
10
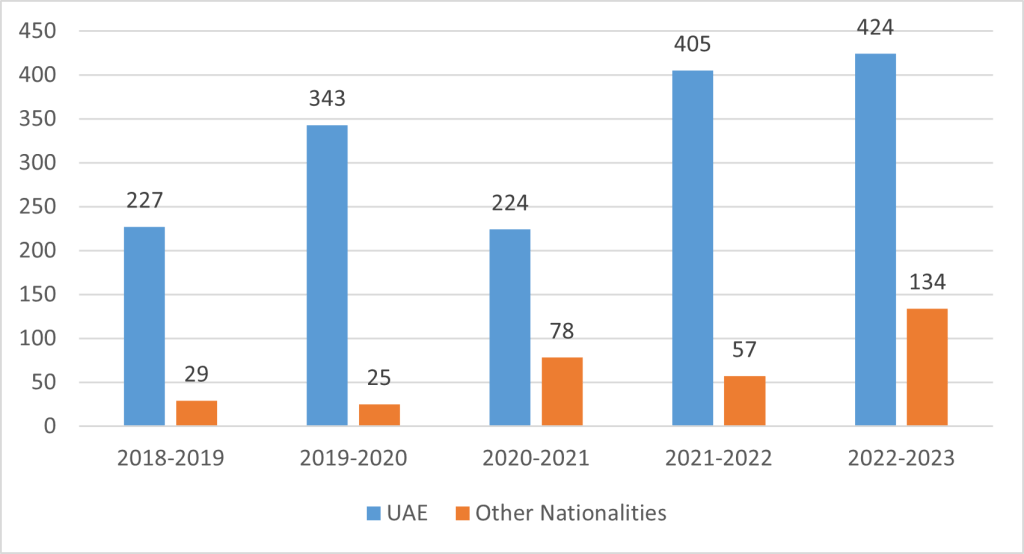
Enrolled Students by Nationality
Academic year
UAE
Other Nationalities
2018-2019
227
29
2019-2020
343
25
2020-2021
224
78
2021-2022
405
57
2022-2023
424
134
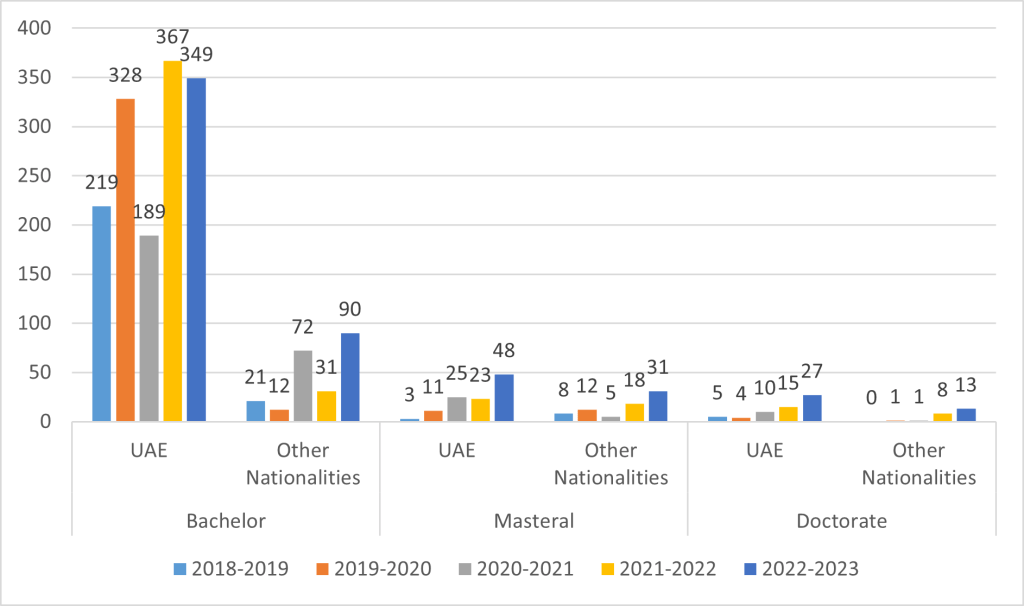
Enrolled Students by Nationality for Each Program
Academic year
Bachelor
Masteral
Doctorate
UAE
Other Nationalities
UAE
Other Nationalities
UAE
Other Nationalities
2018-2019
219
21
3
8
5
0
2019-2020
328
12
11
12
4
1
2020-2021
189
72
25
5
10
1
2021-2022
367
31
23
18
15
8
2022-2023
349
90
48
31
27
13
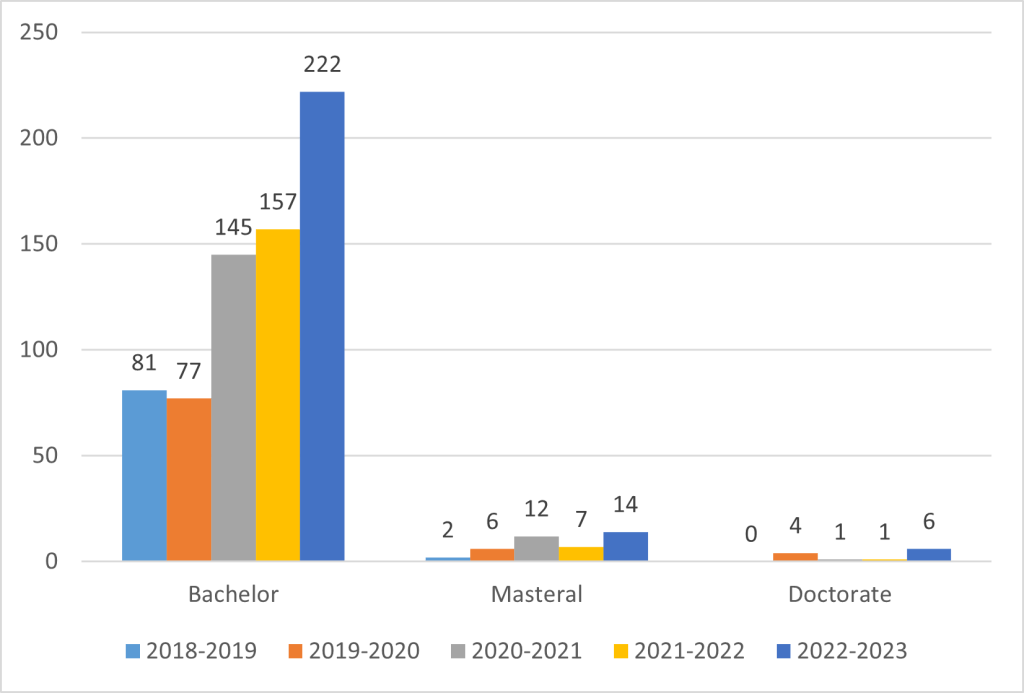
Alumni Distribution by Program
Academic year
Bachelor
Masteral
Doctorate
2018-2019
81
2
0
2019-2020
77
6
4
2020-2021
145
12
1
2021-2022
157
7
1
2022-2023
222
14
6
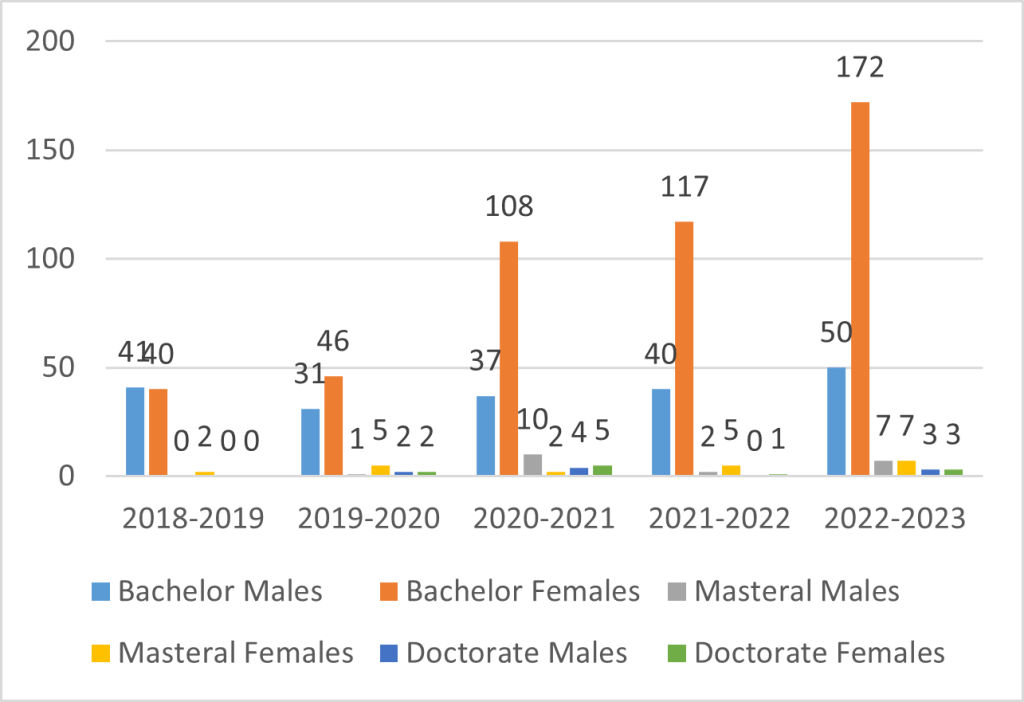
Alumni Distribution (males/females) by Program
Academic year
Bachelor
Masteral
Doctorate
Males
Females
Males
Females
Males
Females
2018-2019
41
40
0
2
0
0
2019-2020
31
46
1
5
2
2
2020-2021
37
108
10
2
4
5
2021-2022
40
117
2
5
0
1
2022-2023
50
172
7
7
3
3
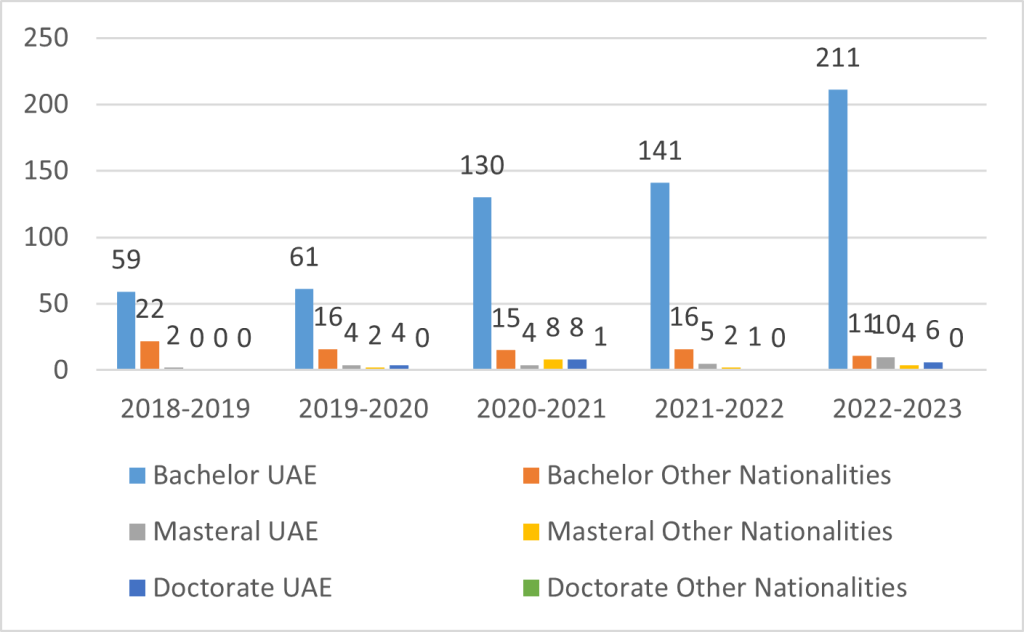
Distribution of Alumni by Nationality
Academic year
Bachelor
Masteral
Doctorate
UAE
Other Nationalities
UAE
Other Nationalities
UAE
Other Nationalities
2018-2019
59
22
2
0
0
0
2019-2020
61
16
4
2
4
0
2020-2021
130
15
4
8
8
1
2021-2022
141
16
5
2
1
0
2022-2023
211
11
10
4
6
0
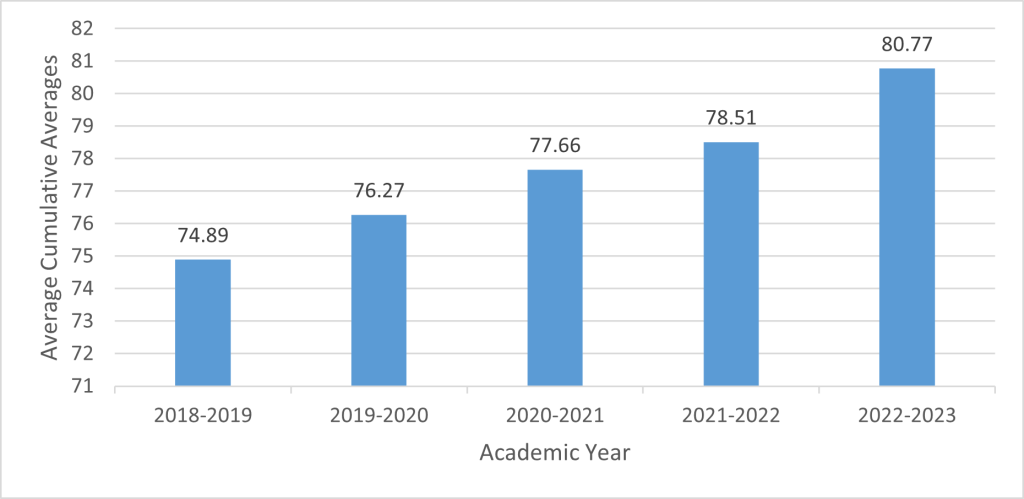
Cumulative Average Statistics for the Bachelor Program
Academic Year
Average Cumulative Averages
1
2018-2019
74.89
2
2019-2020
76.27
3
2020-2021
77.66
4
2021-2022
78.51
5
2022-2023
80.77
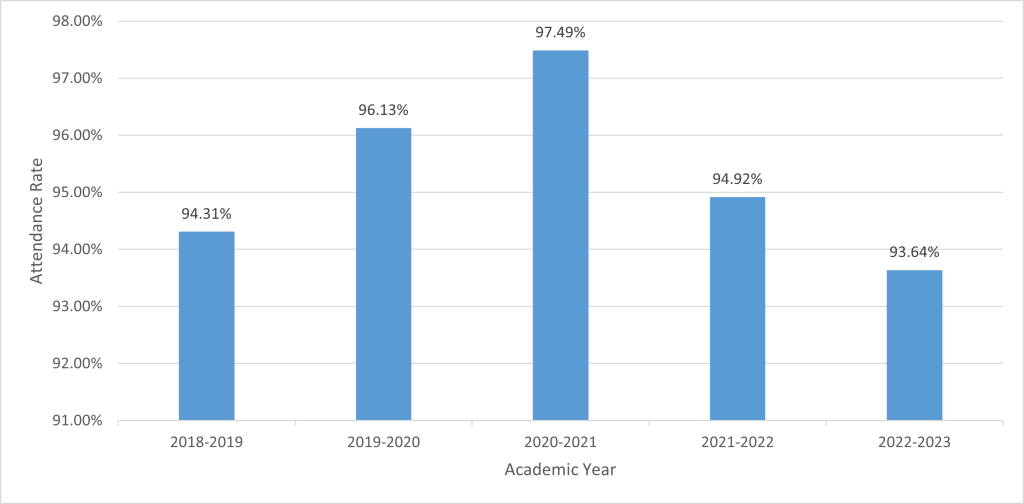
Attendance and Absence Statistics for the Bachelor Program
Academic Year
Attendance Rate
1
2018-2019
94.31%
2
2019-2020
96.13%
3
2020-2021
97.49%
4
2021-2022
94.92%
5
2022-2023
93.64%
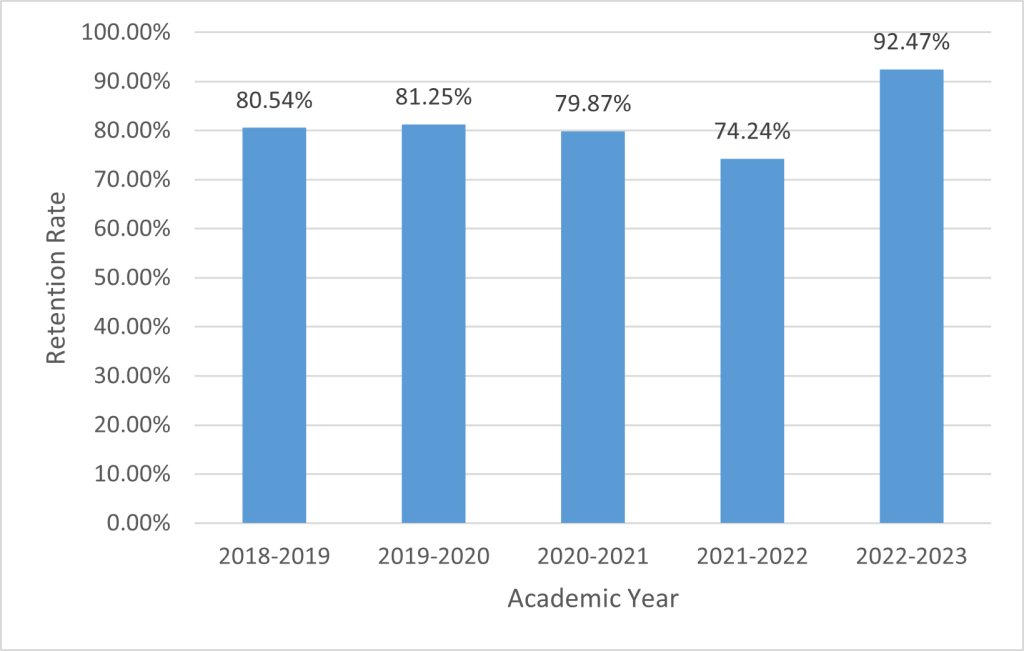
Student Retention Statistics for the Bachelor Program
Academic Year
Retention Rate
1
2018-2019
80.54%
2
2019-2020
81.25%
3
2020-2021
79.87%
4
2021-2022
74.24%
5
2022-2023
92.47%
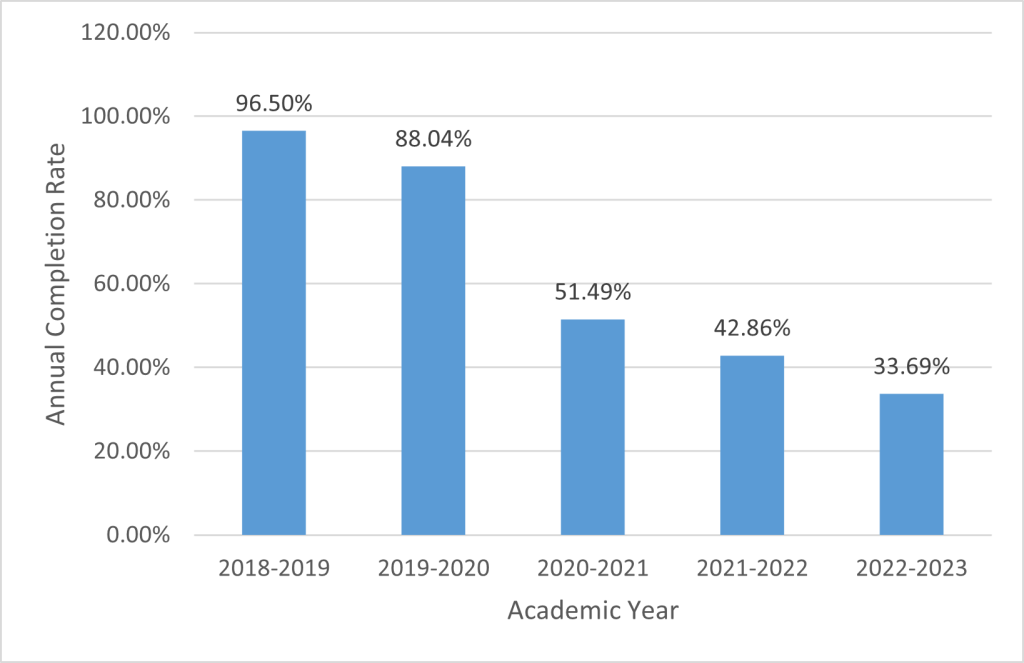
Annual Completion Rate Statistics for the Bachelor Program
Academic Year
Annual Completion Rate
1
2018-2019
96.50%
2
2019-2020
88.04%
3
2020-2021
51.49%
4
2021-2022
42.86%
5
2022-2023
33.69%
Chat with us
, powered by
LiveChat